Kalmar publishes comparative information for reporting segments and the Group’s key figures from year 2022 onwards
KALMAR CORPORATION, STOCK EXCHANGE RELEASE, 3 JULY 2024 AT 10:00 AM EEST
Kalmar publishes comparative information for reporting segments and the Group’s key figures from year 2022 onwards
Kalmar publishes comparative information for reporting segments and the Group’s key figures from year 2022 onwards. In the carve-out financial statements which were published as part of the 22 May 2024 dated demerger and listing prospectus, Kalmar was reported as one segment. As presented in the demerger and listing prospectus, Kalmar’s reporting business segments are Equipment and Services as from 1 July 2024. Kalmar offers a wide range of heavy material handling equipment and services to ports and terminals, distribution centres, manufacturing industries and to heavy logistics.
Kalmar publishes comparison figures for reporting segments and certain other unpublished Group’s key figures from years 2022 and 2023 as well as Q1-Q4/2023 and Q1/2024.
Outlook for 2024 unchanged
Kalmar reiterates its outlook published on 1 July 2024 stating that Kalmar’s comparable operating profit margin as a standalone company is estimated to be above 11 percent in 2024.
Kalmar’s reporting segments
Equipment
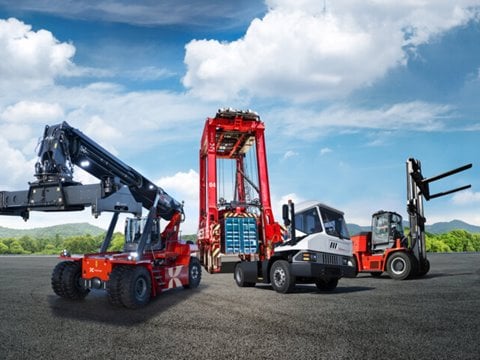
The Equipment segment consists of a portfolio of heavy material handling equipment to ports and terminals, distribution centres, manufacturing industries and heavy logistics. The Company’s equipment range includes reachstackers, forklift trucks, empty container handlers, terminal tractors, straddle carriers and Bromma spreaders.
Services
The Services segment consists of an offering of solutions to ensure Kalmar’s equipment uptime and productivity. Key offering includes spare parts, on-call and contract maintenance services, as well as lifecycle services, including refurbishments, fleet management and upgrades. Data, analytics and AI have a central role in the services offering.
Other
Other consists of Kalmar’s management and headquarter functions as well as the cost of certain central functions that are not allocated to business segments. In addition, activities not included in the Equipment or the Services segments are included in Other. These include the remaining activities related to heavy cranes business, which Kalmar decided to divest in 2022, as well as Kalmar’s share of the profits of the associated company.
The financial information included in this release is unaudited.
For further information, please contact:
Sakari Ahdekivi, CFO, tel. +358 50 400 3557
Carina Geber-Teir, SVP, IR, Marketing & Communications, tel. +358 40 502 4697
About Kalmar
Kalmar (Nasdaq Helsinki: KALMAR) is moving goods in critical supply chains around the world, with the vision to be the forerunner in sustainable material handling equipment and services. The company offers a wide range of industry shaping heavy material handling equipment and services to ports and terminals, distribution centres, manufacturing and heavy logistics. Headquartered in Helsinki, Finland, Kalmar operates globally in over 120 countries and employs approximately 5,000 people. In 2023, the company's sales on a carve-out basis totalled approximately EUR 2.0 billion. www.kalmarglobal.com
Segment information
All information presented is based on carve-out financial information. All figures presented have been rounded, which may cause, for example, the sum of individual figures to deviate from the presented sum total.
| Sales, MEUR | 2022 | 2023 | Q1/23 | Q2/23 | Q3/23 | Q4/23 | Q1/24 |
| Equipment | 1,318 | 1,442 | 339 | 390 | 354 | 358 | 303 |
| Services | 549 | 567 | 145 | 142 | 135 | 145 | 136 |
| Other | 76 | 41 | 1 | 20 | 14 | 6 | 0 |
| Internal sales | 0 | 0 | 0 | 0 | 0 | 0 | 0 |
| Total | 1,943 | 2,050 | 485 | 552 | 503 | 509 | 439 |
| Sales by geographical area, MEUR | 2022 | 2023 | Q1/23 | Q2/23 | Q3/23 | Q4/23 | Q1/24 |
| Europe | 697 | 719 | 166 | 172 | 177 | 204 | 194 |
| Finland | 29 | 49 | 13 | 14 | 11 | 12 | 9 |
| Other Europe | 667 | 669 | 153 | 158 | 166 | 192 | 185 |
| Americas | 842 | 950 | 235 | 270 | 231 | 213 | 167 |
| United States | 651 | 735 | 177 | 209 | 183 | 166 | 124 |
| Other Americas | 191 | 215 | 58 | 62 | 48 | 46 | 43 |
| AMEA | 404 | 381 | 85 | 109 | 95 | 92 | 78 |
| Total | 1,943 | 2,050 | 485 | 552 | 503 | 509 | 439 |
| Sales by geographical area, % | 2022 | 2023 | Q1/23 | Q2/23 | Q3/23 | Q4/23 | Q1/24 |
| Europe | 36% | 35% | 34% | 31% | 35% | 40% | 44% |
| Finland | 2% | 2% | 3% | 2% | 2% | 2% | 2% |
| Other Europe | 34% | 33% | 32% | 29% | 33% | 38% | 42% |
| Americas | 43% | 46% | 48% | 49% | 46% | 42% | 38% |
| United States | 34% | 36% | 36% | 38% | 36% | 33% | 28% |
| Other Americas | 10% | 10% | 12% | 11% | 10% | 9% | 10% |
| AMEA | 21% | 19% | 17% | 20% | 19% | 18% | 18% |
| Total | 100% | 100% | 100% | 100% | 100% | 100% | 100% |
| Orders received, MEUR | 2022 | 2023 | Q1/23 | Q2/23 | Q3/23 | Q4/23 | Q1/24 |
| Equipment | 1,526 | 1,167 | 329 | 302 | 266 | 270 | 247 |
| Services | 542 | 538 | 142 | 135 | 126 | 136 | 155 |
| Other | 13 | 0 | 0 | 0 | 0 | 0 | 0 |
| Total | 2,081 | 1,705 | 471 | 437 | 392 | 405 | 402 |
| Orders received by geographical area, MEUR | 2022 | 2023 | Q1/23 | Q2/23 | Q3/23 | Q4/23 | Q1/24 |
| Europe | 728 | 708 | 191 | 192 | 174 | 150 | 179 |
| Americas | 970 | 608 | 184 | 149 | 106 | 169 | 130 |
| AMEA | 383 | 389 | 95 | 96 | 112 | 86 | 94 |
| Total | 2,081 | 1,705 | 471 | 437 | 392 | 405 | 402 |
| Orders received by geographical area, % | 2022 | 2023 | Q1/23 | Q2/23 | Q3/23 | Q4/23 | Q1/24 |
| Europe | 35% | 42% | 41% | 44% | 45% | 37% | 44% |
| Americas | 47% | 36% | 39% | 34% | 27% | 42% | 32% |
| AMEA | 18% | 23% | 20% | 22% | 28% | 21% | 23% |
| Total | 100% | 100% | 100% | 100% | 100% | 100% | 100% |
| Order book, MEUR | 2022 | 2023 | Q1/23 | Q2/23 | Q3/23 | Q4/23 | Q1/24 |
| Equipment | 1,254 | 928 | 1,224 | 1,146 | 1,063 | 928 | 859 |
| Services | 123 | 90 | 119 | 108 | 98 | 90 | 105 |
| Other | 51 | 7 | 47 | 26 | 11 | 7 | 7 |
| Total | 1,428 | 1,024 | 1,390 | 1,281 | 1,172 | 1,024 | 972 |
| Operating profit and EBITDA, MEUR | 2022 | 2023 | Q1/23 | Q2/23 | Q3/23 | Q4/23 | Q1/24 |
| Equipment | 106.0 | 201.8 | 43.9 | 56.8 | 51.4 | 49.7 | 39.3 |
| Services | 99.0 | 95.6 | 27.0 | 25.6 | 21.8 | 21.2 | 22.8 |
| Other | -86.8 | -57.2 | -15.0 | -10.8 | -13.7 | -17.7 | -16.3 |
| Operating profit | 118.3 | 240.2 | 55.9 | 71.6 | 59.4 | 53.2 | 45.8 |
| Depreciation, amortisation and impairment | 52.4 | 57.2 | 14.0 | 14.1 | 14.1 | 15.0 | 13.7 |
| EBITDA | 170.7 | 297.4 | 70.0 | 85.8 | 73.5 | 68.2 | 59.5 |
| Operating profit, % | 2022 | 2023 | Q1/23 | Q2/23 | Q3/23 | Q4/23 | Q1/24 |
| Equipment | 8.1% | 14.0% | 12.9% | 14.6% | 14.5% | 13.9% | 13.0% |
| Services | 18.0% | 16.9% | 18.6% | 18.1% | 16.1% | 14.6% | 16.8% |
| Other | < -100% | < -100% | < -100% | -53.1% | -98.8% | < -100% | < -100% |
| Total | 6.1% | 11.7% | 11.5% | 13.0% | 11.8% | 10.5% | 10.4% |
| Items affecting comparability, MEUR | 2022 | 2023 | Q1/23 | Q2/23 | Q3/23 | Q4/23 | Q1/24 |
| Equipment | -0.4 | - | 0.0 | 0.0 | - | - | 0.0 |
| Services | -0.8 | 0.0 | 0.0 | 0.0 | - | 0.0 | 0.0 |
| Other | -49.4 | -14.6 | -0.5 | 0.1 | -7.1 | -7.1 | -8.2 |
| Items affecting comparability, total | -50.6 | -14.5 | -0.4 | 0.0 | -7.1 | -7.0 | -8.1 |
| Restructuring costs | -41.9 | -1.2 | -0.4 | 0.0 | -0.5 | -0.3 | -0.1 |
| Other items affecting comparability | -8.7 | -13.3 | - | - | -6.6 | -6.7 | -8.1 |
| Comparable operating profit, MEUR | 2022 | 2023 | Q1/23 | Q2/23 | Q3/23 | Q4/23 | Q1/24 |
| Equipment | 106.5 | 201.8 | 43.9 | 56.8 | 51.4 | 49.7 | 39.3 |
| Services | 99.8 | 95.6 | 27.0 | 25.6 | 21.8 | 21.2 | 22.8 |
| Other | -37.4 | -42.7 | -14.6 | -10.8 | -6.7 | -10.6 | -8.1 |
| Total | 168.9 | 254.7 | 56.3 | 71.6 | 66.5 | 60.3 | 53.9 |
| Comparable operating profit, % | 2022 | 2023 | Q1/23 | Q2/23 | Q3/23 | Q4/23 | Q1/24 |
| Equipment | 8.1% | 14.0% | 12.9% | 14.6% | 14.5% | 13.9% | 13.0% |
| Services | 18.3% | 16.9% | 18.6% | 18.1% | 16.1% | 14.6% | 16.7% |
| Other | -49.3% | < -100% | < -100% | -53.4% | -47.8% | < -100% | < -100% |
| Total | 8.7% | 12.4% | 11.6% | 13.0% | 13.2% | 11.8% | 12.3% |
| Average number of employees | 2022 | 2023 | Q1/23 | Q2/23 | Q3/23 | Q4/23 | Q1/24 |
| Equipment | 2,624 | 2,662 | 2,656 | 2,669 | 2,679 | 2,662 | 2,542 |
| Services | 2,291 | 2,233 | 2,251 | 2,235 | 2,241 | 2,233 | 2,161 |
| Other | 147 | 231 | 202 | 218 | 228 | 231 | 426 |
| Total | 5,062 | 5,125 | 5,109 | 5,121 | 5,147 | 5,125 | 5,129 |
| Number of employees at the end of the period | 2022 | 2023 | Q1/23 | Q2/23 | Q3/23 | Q4/23 | Q1/24 |
| Equipment | 2,653 | 2,562 | 2,666 | 2,702 | 2,699 | 2,562 | 2,535 |
| Services | 2,269 | 2,188 | 2,227 | 2,235 | 2,243 | 2,188 | 2,164 |
| Other | 177 | 241 | 217 | 233 | 244 | 241 | 419 |
| Total | 5,099 | 4,991 | 5,110 | 5,170 | 5,186 | 4,991 | 5,118 |
| Number of employees at the end of the period by geographical area | 2022 | 2023 | Q1/23 | Q2/23 | Q3/23 | Q4/23 | Q1/24 |
| Europe | 2,903 | 2,806 | 2,918 | 2,947 | 2,952 | 2,806 | 2,946 |
| Americas | 620 | 616 | 634 | 682 | 662 | 616 | 600 |
| AMEA | 1,576 | 1,569 | 1,558 | 1,541 | 1,572 | 1,569 | 1,572 |
| Total | 5,099 | 4,991 | 5,110 | 5,170 | 5,186 | 4,991 | 5,118 |
Other comparative information
| Kalmar Group, carve-out | 2022 | 2023 | Q1/23 | Q2/23 | Q3/23 | Q4/23 | Q1/24 |
| Gross profit, MEUR | 385.5 | 509.3 | 122.2 | 132.6 | 121.9 | 132.5 | 112.4 |
| Gross profit, % of sales | 19.8% | 24.8% | 25.2% | 24.0% | 24.2% | 26.0% | 25.6% |
| Profit before taxes, MEUR | 117.5 | 241.5 | 55.6 | 71.4 | 61.1 | 53.4 | 47.7 |
| Profit before taxes, % of sales | 6.0% | 11.8% | 11.5% | 12.9% | 12.1% | 10.5% | 10.9% |
| Profit for the period, MEUR | 92.6 | 193.8 | 44.9 | 55.8 | 49.7 | 43.3 | 33.4 |
| Profit for the period, % of sales | 4.8% | 9.5% | 9.3% | 10.1% | 9.9% | 8.5% | 7.6% |
| Cash flow from operations before finance items and taxes, MEUR | 178.5 | 256.8 | -2.0 | -1.5 | 131.3 | 128.9 | 101.7 |
| Return on capital employed (ROCE), last 12 months, % | 12.4% | 24.4% | 15.4% | 22.7% | 23.2% | 24.4% | 22.5% |


